Aphids probably are of greater economic importance as crop pests worldwide than are defoliating insects (Blackman and Eastop 2000). This is based primarily on their cryptic nature of feeding, their small size, their high reproductive potential, and their ability to act as vectors of plant viruses (Clark and Perry 2002, Davis et al. 2005). Until aphids are extremely abundant, direct feeding injury often goes unrecognized and indirect injury caused by infection by aphid-transmitted plant viruses occur days or weeks following inoculation. Direct feeding injury caused by colonizing aphids is through the insertion of their needle-like mouthparts (stylets) directly into the vascular tissue (phloem) and removing plant sap. Photosynthate destined for seed production and plant growth is thus diverted into energy for insect growth. Aphids reproduce using a form of asexual reproduction called parthenogenesis where only females are present, giving birth to live young (up to 12 per day). Under optimal conditions these new born nymphs mature into a reproducing adult within as little as five days. This article will focus on the direct damage caused by soybean aphids, Aphis glycines Matsumura, in the North Central Region.
Soybean Aphid in the North Central Region
Soybean aphid, an insect native to Asia, was first detected in North America in 2000 nearly simultaneously in 10 Midwestern states. Prior to this discovery, insect or mite outbreaks in soybean were relatively uncommon, and integrated pest management (IPM) programs were restricted almost exclusively to defoliating and seed feeding insects. Just five years after the initial discovery of soybean aphid, this insect now represents the most significant insect threat to soybean production in the North Central Region, far outpacing the role of defoliators.
An informal phone and e-mail survey conducted fall 2005 of extension entomologists in several states estimated that 15 million acres were treated for soybean aphid. Approximately 10% of treated acres received a second application when aphid populations rebounded. The 2005 growing season is the third year out of the last five where damaging aphid populations occurred over a large part of the North Central states. Insecticide use added an estimated $5 to $24 per acre to the cost of soybean production in 2005. Growers or crop consultants must now scout for soybean aphids as a part of their routine crop management.
Here we summarize the research results that support the currently recommended economic threshold (ET). Soybean rust is another invasive, exotic pest that producers will need to manage in the future. These two pests usher in a new era in soybean IPM. Integration in soybean IPM must become the focal point of pest management programs. These exotic pests have permanently changed how soybeans are currently managed in the North Central Region. Never again will soybean production be a relatively pest-free crop in North America.
Soybean Aphid Damage Potential
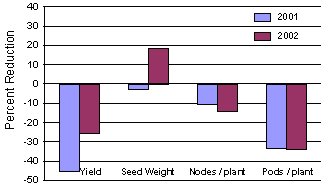
In China and in other parts of Asia, soybean aphid is described as an occasional pest of soybean. Wang et al. (1996) demonstrated that when fields were colonized by soybean aphid during early vegetative growth, yield loss in excess of 50% occurred. In Minnesota, we have documented that yield loss caused by soybean aphid is primarily due to premature pod abscission (Fig. 1). Flowering stages are most sensitive to aphid feeding and high aphid populations during plant growth stages R1 through growth stage R4 (Fehr et al., 1971) can result in early pod abscission. If aphids are controlled after pods are lost, only a portion of the yield loss sustained by reducing pod set can be recovered through an increase in seed size. It is imperative to scout fields just prior to flowering and throughout the pod set period.
In this paper we will focus on three main topics: 1. the current recommended economic threshold and scouting methods to assess if treatable populations exist, 2. the role biological control can play in permanently reducing soybean aphid populations, and 3. the interaction fungicides used for soybean rust control have on soybean aphids and the aphid-infecting fungi.
1. Economic Thresholds and Scouting
Researchers throughout the North Central Region have collaborated over the past five years resulting is a robust set of field experiments from which the economic injury level (EIL) and economic threshold (ET) for soybean aphid were estimated. As with most newly introduced invasive pests, soybean aphid has yet to attain a stable equilibrium. Soybean aphid will continue to adapt to North America as will the natural enemy community that will utilize this available resource. Therefore, thresholds will need continued refinement as yield expectations, control costs, natural enemies, and soybean aphid population growth rates become better understood. The current ET value is applicable over a wide range of yield and price expectations. This threshold was developed through a North Central Soybean Research Program (NCSRP) grant, a grower funded regional research program, involving collaborators from 9 Midwestern states. The ET was calculated to be an average of 250 aphids per plant with more than 80% of plants infested with aphids and is valid through growth stage R5 (beginning seed set). This threshold provides producers with a 7-day window where treatment can occur before loss exceeds the cost of control. In the future more dynamic thresholds will be developed which can account for more variables, such as plant stage and aphid resistant or partially resistant varieties. The current threshold will prevent the catastrophic losses observed in 2003 and as more data are collected, more refined thresholds will be developed that are more site-specific in their application. In Minnesota, we have documented yield losses that approach 50% caused by soybean aphid. During these aphid outbreaks it is imperative that controls are applied in a timely manner. Often a few days delay may separate acceptable yield from massive yield loss. However, soybean aphid population growth rates have varied tremendously and are not consistent from year to year or even within years. Clearly, there is yet much to learn with regard to the factors that impact aphid population growth rates. On a regional scale, since 2000 there have been years where aphid populations either did not attain damaging levels or peak aphid abundance occurred much later in the growing season (R6; full size seed in pods) greatly reducing the damage potential. Yield loss can still occur during late R5 and into R6, but the aphid densities that result in significant yield losses are substantially higher than the current threshold. The exact ET value for late season aphid infestation has not yet been defined.
Materials and Methods
Field plot design. In the NCSRP funded project, a common experimental approach was used by all participants. At each field site, a soybean variety adapted for that area was selected and planted within the normal range of planting dates for each location. Plots were four rows (30-inch) by 50 feet in length. Fallow ground surrounded each plot to facilitate treatment of individual plots with insecticide, to minimize spray drift among plots, and to encourage uniform aphid colonization throughout the experiment since winged aphids are known to be attracted to field edges (DiFonzo et al. 1996). Soybean aphids were allowed to naturally colonize the plots; however, aphids from a laboratory colony were distributed uniformly in the center two rows of each plot if aphids were not found colonizing plants by mid vegetative growth (V5). Foliar insecticides were applied at predetermined aphid population levels. Once the average target aphid density was reached, an insecticide was applied to all replicates of this treatment the following day. Each target aphid density (=treatment) was replicated a minimum of four times and treatments were arranged in a completely randomized block design. If aphid populations started to rebound following the initial treatment, additional applications were made to prevent further aphid population development. Yield was estimated by harvesting the middle two rows and adjusting moisture to 13%. Maximum yield at each location was measured in replicated plots where aphids were controlled throughout the season by repeated application of insecticide.
Aphid sampling. Whole plant samples were used to enumerate total number of aphids per plant. To detect small populations early in the season up to 20 nonconsecutive plants were counted nondestructively in each plot. As the aphid population increased and percentage of plants infested increased, the number of plants sampled per plot was reduced to a minimum of five plants per plot when 100% of plants were colonized. All data were converted to average number of aphids per plant to account for the varying number of plants sampled. Plant growth stage was noted each week so aphid population density could be correlated with a particular plant growth stage. As a measure of seasonal aphid abundance, we calculated cumulative aphid days (CAD) using procedures outlined in Hanafi et al. (1989). Cumulative aphid-days represent the area under the aphid population curve and it provides a single number that describes aphid density over the entire season.
Results and Discussion
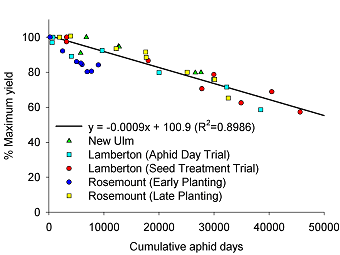
Calculation of an Economic Injury Level (EIL) and Economic Threshold (ET). Five replicated field plots were used to calculate the initial yield-loss relationship between CAD and yield. The resulting linear regression equation (Fig. 2) was used to estimate aphid density associated with yield loss. The first step in this process is to calculate a “gain threshold” where the cost of control ($/ac) is expressed in bu/ac. For example, if cost of control was $12/ac and soybeans were sold at $6.00/bu, the gain threshold would be 2 bu/ac. Since yield and price are two variables that change, we express the gain threshold in terms percent yield loss over a range of expected yield and price scenarios. With five replicated field experiments used to calculate the yield-loss relationship with CAD we could not use actual yield to express this relationship since yield potential among fields varied. We expressed all yield loss as a percent yield loss relative to the aphid-free plots, i.e., this treatment was assumed to represent the maximum potential yield for that location (100%). The relationship between CAD and percent yield loss is shown in Fig. 2. The EIL was calculated by setting control costs at $12.00 per acre which includes the chemical cost and the cost of custom application (air). We then used a range of yield expectations and price to develop a matrix of percent yield loss that would equal the cost of control (Table 1). By substituting the percent yield loss in Table 1 in the equation in Fig. 2, we express the EIL in terms of CAD required to suppress yield equal to the cost of control (Table 2).
| Price ($/bu) | Expected Yield (bu/acre) | ||
|---|---|---|---|
| 60 | 50 | 40 | |
| $5.00 | 4.0 | 4.8 | 6.0 |
| $6.00 | 3.3 | 4.0 | 5.0 |
| $7.00 | 2.8 | 3.4 | 4.3 |
| Price ($/bu) | Expected Yield (bu/acre) | ||
|---|---|---|---|
| 60 | 50 | 40 | |
| $5.00 | 5,444 | 6,333 | 7,667 |
| $6.00 | 4,703 | 5,444 | 6,556 |
| $7.00 | 4,175 | 4,810 | 5,762 |
The 7-day lead time built into the ET makes two assumptions: 1. that aphid populations are increasing, and 2. that a producer needs a minimum of 7 days to make arrangements for a field to be treated. The 7 day lag time also allows producers to reassess aphid populations just prior to spraying to assure that aphid populations are still rising and to account for inclement weather that precludes applying a foliar insecticide. To convert CAD to aphids per plant we used a range of aphid growth rates. Population doubling times for soybean aphid has been estimated to be as small as 1.3 days in laboratory experiments where temperature was held constant (McCornack et al. 2004). Population growth rates observed in the field are lower, partly due to fluctuating temperatures, but also because natural enemies and plant quality act in tandem to reduce growth rates. The values used to calculate the ET represent actual population growth rates observed in field plots during aphid outbreaks.
The estimated number of aphids per plant where the EIL will be reached in 7 days is shown in Tables 3a and 3b. The difference between the values in the two tables is the population doubling time of either 2 or 3 days, respectively. We are currently collecting and analyzing data to improve our population growth rates estimates.
| Price ($/bu) | Expected Yield (bu/acre) | ||
|---|---|---|---|
| 60 | 50 | 40 | |
| $5.00 | 199 | 232 | 281 |
| $6.00 | 172 | 199 | 240 |
| $7.00 | 153 | 176 | 211 |
| Overall Average | 207 | ||
| Price ($/bu) | Expected Yield (bu/acre) | ||
|---|---|---|---|
| 60 | 50 | 40 | |
| $5.00 | 281 | 323 | 396 |
| $6.00 | 243 | 281 | 338 |
| $7.00 | 215 | 248 | 297 |
| Overall Average | 291 | ||
Data from field cages where predators, parasites and weather events, (e.g., pounding rain) are largely minimized or absent, provide biased estimates of population growth rates. Such estimates like those developed in laboratory experiments are not appropriate to use to calculate an ET value. Tedious counting of aphids in replicated field plots along with evaluating the biotic and abiotic factors associated with aphid population growth rates are needed to refine the current ET value. If aphid population growth rates are substantially reduced, whether by predators or other natural enemies, there may be enough population regulation to prevent aphids from reaching the EIL. Indeed, in Minnesota this is exactly what we observed in several replicated field trials in 2005. Threshold densities were attained, but EIL densities were not, thus treatment did not result in a yield benefit equal to the cost of control (Fig. 3).
A question might be why with all of these variables have we chosen to use a single ET value? The answer is entangled with the aphid population growth rate estimates. No matter which estimate of population growth rate is used (2 or 3 day doubling times), the difference between 153 (lowest price, lowest yield potential, slowest growth rate, Table 3a) and 396 aphid per plant (highest yield potential, highest price, fastest aphid population growth rate, Table 3b), is at most 2 days of reproduction. We chose to simplify the threshold by taking an average ET across all price, yield and population growth rate estimates (Tables 3a and 3b). That average is 249 and we rounded setting the ET to 250 aphids per plant. To improve on this threshold requires better estimates of population doubling time. The caveat of 80% or more of the plants infested with aphids prevents treating an entire field when only a portion of the field may be infested, e.g., a hot spot within a single field.
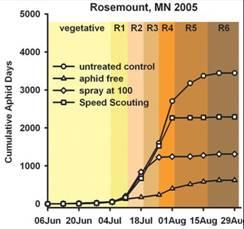
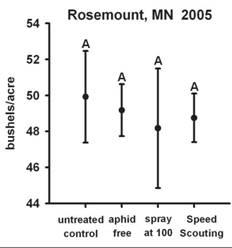
Figure 3: Cumulative aphid-days (CAD) at Rosemount, MN 2005 and associated yield.
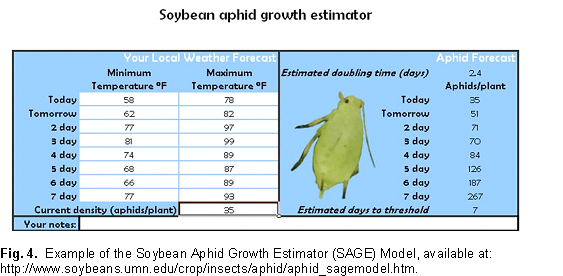
For soybean aphid population growth rate is governed largely by weather (temperature and precipitation, density independent mortality factors) and natural enemies (density dependant mortality factors). To demonstrate how one factor, temperature, can drive aphid population growth rates, we have developed a simple model that runs with Microsoft Excel®. The model is available at a University of Minnesota web site and it allows producers to use locally obtained forecasted weather data (daily min and max temperatures) to estimate soybean aphid density. The population growth rate used in this model is one where aphid populations are growing in the absence of predation and without plant stress. This Soybean Aphid Growth Estimator (SAGE) model is strictly a temperature based population growth model. It provides an estimate of the aphid density that could be attained given ideal conditions (high plant quality and lack of natural enemies). Aphid population growth rate observed in the field will always be lower than this estimate. What this model does is predict the fewest number of days it could take for soybean aphids to reach threshold densities. The difference you observe from this estimate and what is actually observed on your farm is thus the cumulative benefit of natural enemies, adverse weather events (other than temperature), and other factors such as plant quality that work in concert to slow soybean aphid population growth rates.
Sampling Aphid Populations. Another question that is commonly asked is, “How can I spend less time sampling for soybean aphids? It just takes too long to count individual aphids on 30 plants per field.” In response to this often asked question, we have developed a binomial sequential sampling program for soybean aphid and have termed this method as "Speed Scouting". Rather than count aphids on plant a producer or consultant only needs to train their eye to estimate how many aphids are present and then tally the number of plants that are infested with 40 or more aphids (Hodgson et al. 2004) The initial estimates were developed using only Minnesota data sets (86 data sets using weekly counts), but in 2005 entomologists across the region collaborated in a validation of “Speed Scouting” to determine if a treatment decision recommended by “Speed Scouting” actually had aphid populations greater than 250 aphids per plant. The advantages to “Speed Scouting” are most pronounced when aphid populations are low (most plants have fewer than 40 aphids) or when aphid populations are high (all plants have 40 or more aphids per plant). It takes less time and fewer plants to make a decision to treat or not to treat. “Speed Scouting” eliminates the need to count aphids at high densities which is so time consuming.
“Speed Scouting” is based on a mathematical relationship between actual aphid densities and it is NOT a new ET. For example, at high aphid densities if the first 11 plants sampled have 40 or more aphids, you are finished sampling and the decision is to treat the field within the next 7 days. If you took the time to count aphids on a random sample of 30 plants, the average density would be greater than or equal to 250 aphids per plant.
View data sheets for “Speed Scouting”
The disadvantage to “Speed Scouting” is that to gain speed, you give up precision Preliminary analysis of the validation of “Speed Scouting” in 2005 showed that “Speed Scouting” recommended treatment sooner than was justified by enumerative counts. In other words, “Speed Scouting” was a more conservative than the ET and this modified sampling method resulted in treating more often than had enumerative counts been made (Fig. 3). However, in Minnesota the same could be said for enumerative counts across a broad array of experimental plots since population growth rates in many locations in 2005 were lower than had been observed in previous years. In many replicated field plots, ET densities were reached but aphid density in untreated control plots never reached the EIL. In the future it may be necessary to estimate how quickly populations are growing to prevent treating when in fact no yield loss will occur.
2. Biological Control
Long term control of soybean aphid is the goal of a classical biological control program which is actively being pursued by a consortium of entomologists located at the land grant universities, USDA laboratories, and with overseas collaborators. Classical biological control entails finding natural enemies in the aphid’s native range, determining the host range of these exotic insects when exposed to native aphids in North America, selecting strains or species that will be the most host-specific, and developing methods to release these insects. Biological control has been successfully implemented on a variety of exotic insect pests in the Great Plains, including cereal leaf beetle, alfalfa weevil, Russian wheat aphid and the European corn borer. Many of these biological control programs have reduced an exotic pest from major pest status to occasional pest status. This research is lead by Dr. Bob O’Neil (Purdue University) through another NCSRP funded project on the biological control of soybean aphid. The first release of an exotic soybean aphid natural enemy may occur in 2006, pending federal approval.
Teams of entomologists have brought back natural enemies from China, Korea, and Japan, where soybean aphid is only an occasional pest. Biological control is not designed to eradicate the target pest, but to suppress the population to levels below the ET. Insecticides cannot discriminate pest from beneficial insect. In IPM, the very foundation of this pest control strategy is reliance on natural enemies first and to use insecticides only when natural enemies are failing to keep the pest below the ET. By applying insecticide only when populations exceed the ET we are taking full advantage of the natural enemies already present. Indeed, it has long been observed that biological control is far more successful in low value crops where insecticide use is not justified or in perennial cropping systems where over successive years insecticides are used sparingly. The cropping practices least compatible with biological control are annual cropping systems where much of the acreage is treated each year. Only by carefully integrating ET into your soybean pest management decisions will biological control reach its full potential.
Interaction of Aphid Populations with Fungicides
In 2005, we began a study to evaluate the potential interaction between fungicides and the impact these materials have on a group of little known natural enemies, entomopathogenic fungi. In previous research conducted in Minnesota on potato IPM, there was a clear detrimental effect on these insect-infecting fungi when plots were repeated treated with fungicide. As a result, green peach aphid populations in potato increased to extremely high densities due to the suppression of these insect pathogens (Ruano-Rossil, et al. 2002).
In 2005, we initiated a two year study to evaluate what effect fungicides used for control of soybean rust might have the fungal pathogens that infect soybean aphid. Fungicides were applied with ground equipment delivering 27.1 gal/ac of spray volume and using recommended rates of fungicide. At Rosemount, Minnesota (Fig. 5) fungicides caused no direct toxicity to soybean aphids. In contrast, at Lamberton, Minnesota (Fig. 6), one fungicide treatment appeared to significantly reduce soybean aphid density, but this reduction was not consistent across all plots treated with this fungicide or in equivalent treatments that had a third fungicide applied in late August.
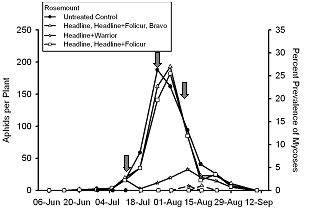
Mortality of soybean aphids caused by entomopathogenic fungi at Rosemount never exceeded 5%, even in the untreated control (Fig. 5). As with plant pathogenic fungi, it takes three interacting factors to result in an active infection: inoculum, susceptible hosts, and a permissive environment. Both inoculum and aphids were present at Rosemount, but the environmental conditions at Rosemount were not conducive for disease development. It was hot, dry and relative humidity was generally too low to allow for infection to occur. Entomopathogenic fungi require several hours of humidity above 95% for sporulation to occur and the predominant aphid-infecting fungus isolated from soybean aphid, Pandora neoaphidis, grows best at relatively cool temperatures. It is interesting to note that spider mites are also kept under control through the action of another entomopathogenic fungus, Neozygites floridana. When environmental conditions are hot and relative humidity is low, the environmental conditions are not met for this fungus to sporulate and infect spider mites. Consequently, two spotted spider mite populations are always associated with drought conditions in the upper Midwest. Another intriguing question that should be asked is what, if any, impact will fungicides have on spider mite populations.
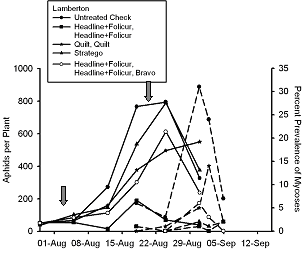
In contrast with the Rosemount data, all conditions were favorable for infection to occur at Lamberton late in the growing season when aphid populations were at peak density. At Lamberton, fungicides suppressed prevalence of fungal-infected aphids by over 90% (Fig. 6). However, fungicides did not cause an increase in peak aphid density as we have observed in potato production systems (Ruano-Rossil, et al. 2002). Recent work at Cornell University (Nielsen & Hajek 2005) showed that prevalence of fungal-infected soybean aphid was greatest when soybean aphid was collected from its overwintering host, buckthorn, Rhamnus cathartica. This is partly because environmental conditions conducive for fungal infection are more prone to occur late in the growing season. During late August in Minnesota, dew point is often reached overnight and night time temperatures are lower.
Overall, fungicides in the first year of this study had little impact on peak aphid density, but fungicides did result in a lower proportion of fungal-infected aphids at a time of the season when aphid are leaving soybean and returning to buckthorn. From these preliminary data we would hypothesize that fungicide use on soybean might result in fewer fungal-infected aphids on buckthorn. Consequently, a higher survival rate of soybean aphids on buckthorn will result in more overwintering eggs to be deposited on buckthorn. If winter temperatures do not drop below the lower lethal point of -29ºF (McCornack et al. 2005) and permit successful overwintering, the result might be higher colonization rates in soybean the following spring.
It remains to be seen if widespread use of fungicides in the North Central Region will affect winter survival of soybean aphid. The potential exists, and this research is an example of how crop protection products can have unintended consequences. We are just beginning to unravel the interrelationships that exist among soybean aphids, entomopathogenic fungi, and fungicides used for soybean rust control.
Conclusion
Soybean IPM is at a crossroads. With new and unpredictable exotic pests present in North America, soybean production has permanently changed. The challenge for researchers is to continue to investigate the possible interactions and solutions for these unintended consequences. For producers it is incumbent upon you to only use pesticides to prevent predictable yield losses. IPM was developed to take advantage of all the biotic and abiotic factors that reduce pest populations and only to use pesticides when natural controls fail to keep pest populations in check. In the short term, insecticides may be necessary to avoid catastrophic losses caused by soybean aphids and fungicides may be needed as well to prevent losses from this exotic disease. What must be avoided is the use of pesticides as cheap insurance. If there is not a target pest to treat or if pest density is below an established ET, there is no reason to treat. There are simply too many consequences of using broad spectrum pesticides if they are not economically justified. Not only does this increase production costs without any economic return, biological and natural control agents can be severely disrupted, not only affecting populations that growing season, but possibly having longer term effects.
References
- Blackman, R. L. and V. F. Eastop. 2000. Aphids on the World's Crops: an Identification and Information Guide, 2nd edition. John Wiley, Chitchester. 476 pp.
- Clark, A. J., and Perry K. L. 2002. Transmissibility of field isolates of soybean viruses by Aphis glycines. Plant Dis. 86:1219-1222.
- Davis, J. A., E. B. Radcliffe, D. W. Ragsdale. 2005. Soybean aphid, Aphis glycines Matsumura, a new vector of Potato Virus Y in potato. Amer. J. Potato Res. 81: 101-105.
- DiFonzo, C. D, D. W. Ragsdale, E. B. Radcliffe, N. C. Gudmestad & G. A. Secor . 1996. Crop borders reduce potato virus Y incidence in seed potato. Annals Appl. Biol. 129: 289-302.
- Fehr, W. R., C. E. Caviness, D. T. Burmood, and J. S. Pennington. 1971. Stage of development descriptions for soybeans, Glycines max L. (Merrill). Crop Sci. 11:929-931.
- Hanafi, A., E.B. Radcliffe, and D.W. Ragsdale. 1989. Spread and control of potato leafroll virus in Minnesota. J. Econ. Entomol. 82: 1201-1206.
- Hodgson, E. W., E. C. Burkness, W. D. Hutchison, and D. W. Ragsdale. 2004. Enumerative and Binomial Sequential Sampling Plans for Soybean Aphid (Homoptera: Aphididae) in Soybean. J. Econ. Entomol. 97(6): 2127-2136.
- McCornack, B. P., D. W. Ragsdale, and R. C. Venette. 2004. Demography of Soybean Aphid (Homoptera: Aphididae) at Summer Temperatures. J. Econ. Entomol. 97(3): 854-861.
- McCornack, B. P., M. A. Carrillo, R. C. Venette, and D.W. Ragsdale. 2005. Physiological constraints to the overwintering distribution of the soybean aphid (Homoptera: Aphididae). Environ. Entomol. 34: 235-240.
- Nielsen, C. and A. E. Hajek. 2005. Control of invasive soybean aphid, Aphis glycines (Hemiptera: Aphididae), populations by existing natural enemies in New York state, with emphasis on entomopathogenic fungi. Environ. Entomol. 34: 1036-1047.
- Ruano-Rossil, J. M., E. B. Radcliffe, D. W. Ragsdale. 2002. In: Dedryver, et. al. (eds), Disruption of entomopathogenic fungi of green peach aphid, Myzus persicae (Sulzer), by fungicides used to control potato late blight, Aphids in a New Millenium, 6th Int. Sympos. Aphids in a New Millennium, INRA, Versailles, pp. 365-370.
- Wang, S., X. Bao, Y. Sun, R. Chen, and B. Zhai. 1996. Study on the effect of population dynamics of soybean aphid (Aphis glycines) on both growth and yield of soybean. Soybean Science (China) 15: 243-247.