Edward B. Radcliffe, Professor Emeritus
Department of Entomology, University of Minnesota
Background
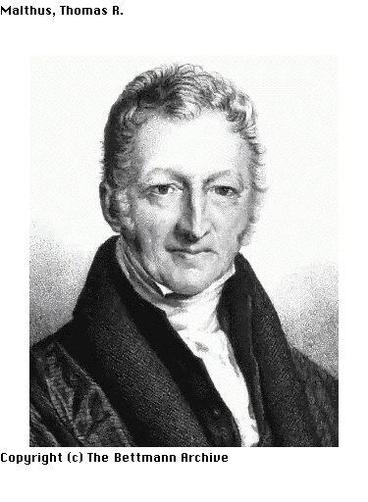
Thomas Malthus
The first significant contribution to the theory of population ecology was that of Thomas Malthus, an English clergyman, who in 1798 published his Essay on the Principle of Population. Malthus introduced the concept that at some point in time an expanding population must exceed supply of prerequisite natural resources, i.e., population increases exponentially resulting in increasing competition for means of subsistence, food, shelter, etc. This concept has been termed the "Struggle for Existence".
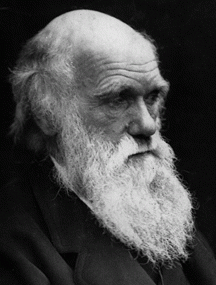
Charles Darwin
Malthus's theories profoundly influenced Charles Darwin 1859, On the Origin of Species, e.g., the concept of "Survival of the Fittest". Mortality of this type can be termed "facultative mortality" (as opposed to catastrophic mortality, e.g., weather, insecticides).
Harry Smith, pioneering biological control worker with the University of California (1935), proposed the equivalent and now accepted terms density-dependent and density-independent. Density-dependent mortality factors are those that are facultative in effect, density-independent mortality factors are those that are catastrophic in effect.
A density-dependent mortality factor is one that causes a varying degree of mortality in subject population, and that the degree of mortality caused in a function (i.e., related) to the density of the subject (affected) population (density-geared, feedback regulation, self-regulating or self-limiting) may and typically involves a lag effect., e.g., most biological control agents.
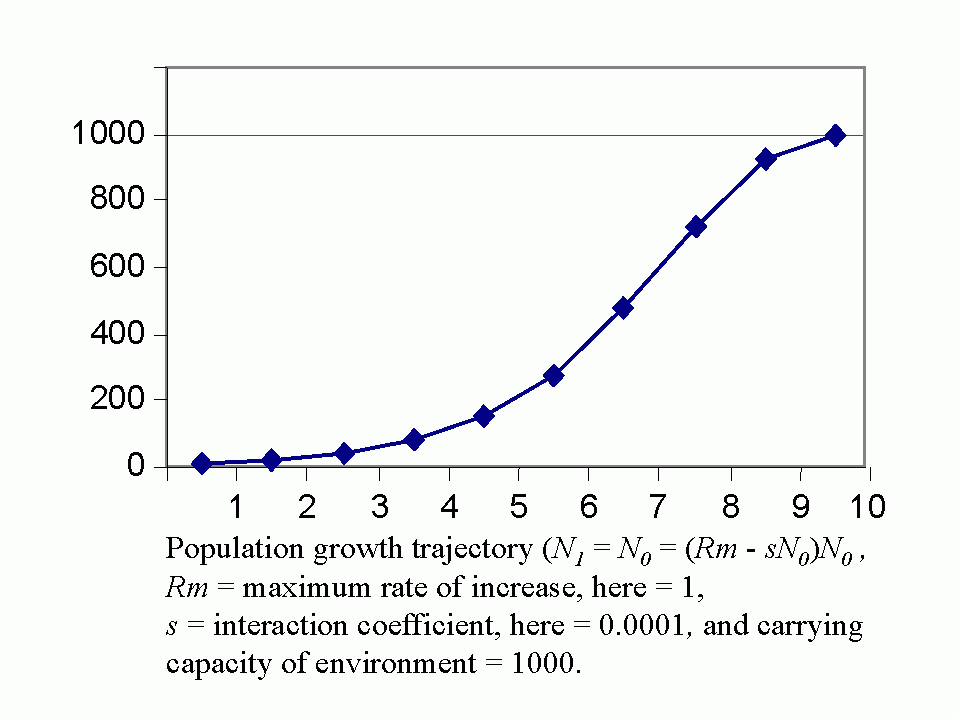
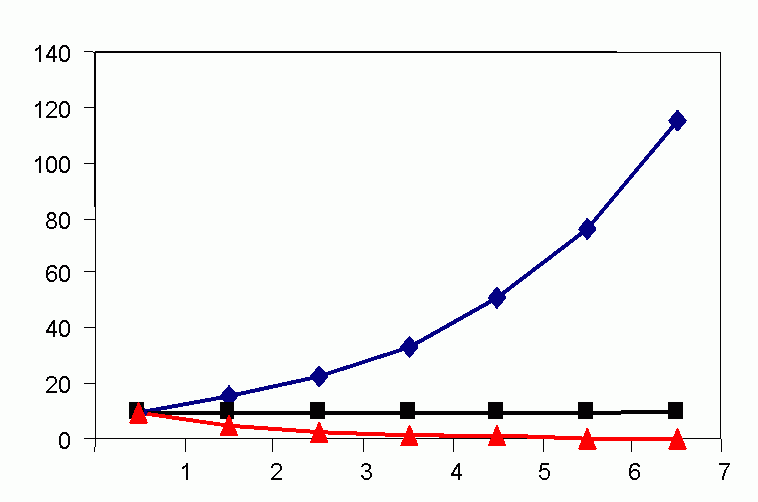
Royal N. Chapman, Univ. Minnesota, in the 1930s proposed the concept of a balance between biotic potential and environmental resistance. Chapman`s model was a mathematical representation of the Malthusian concept, illustrated here by the logistic growth of a laboratory population of yeast cells. Population growth trajectory (N1 = N0 + (Rm -sN0)N0 ); Rm = maximum rate of increase, here = 1, s = interaction coefficient, here = 0,0001, and carrying capacity of environment = 1000.
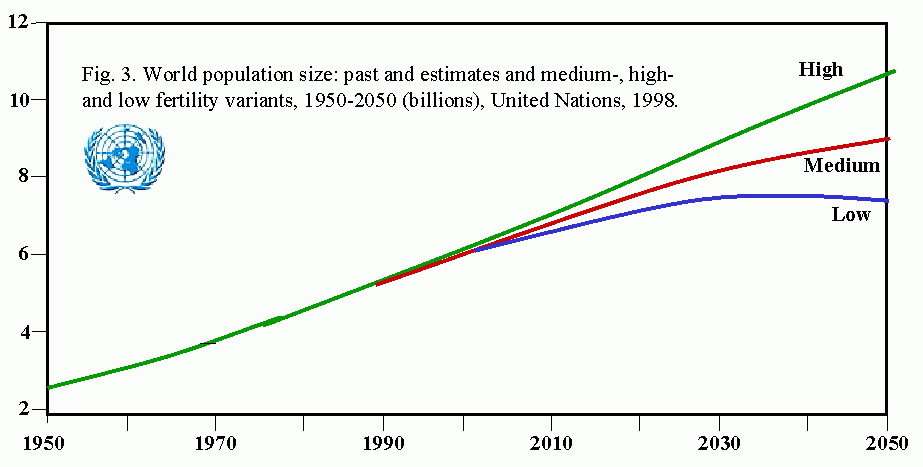
Human populations represent another example of exponential growth. Magnitude of the problems posed by human population growth can be seen from the fact that it took more than 1 million years for the human population to first reach 200,000 (the current daily rate of increase (See: US Census, Historical Estimates of World Population). The human population is estimated to have first reached 1 billion persons in 1830, and 2 billion in 1930, a doubling time of 100 years. In 1960, thirty years later, the population edged past 3 billion, and a mere 15 years later, 4 billion. In 1986, we exceeded 5 billion for the first time. Despite a slowing of the growth rate, it is expected that the human population will exceed 6 billion in early 1999. To feed this population, only as well as we presently do, it will be necessary to increase food production 20% over the next 10-15 years.
Table 1. UN estimates of historical human populations and projections for 21st century (UNDP Press Release, 10/28/1998)
| 1804 | 1 billion |
| 1927 | 2 billion |
| 1960 | 3 billion |
| 1974 | 4 billion |
| 1987 | 5 billion |
| 1999 | 6 billion |
| 2013 | 7 billion |
| 2028 | 8 billion |
| 2054 | 9 billion |
| 2100 | (range of estimates: 10.4-17 billion) |
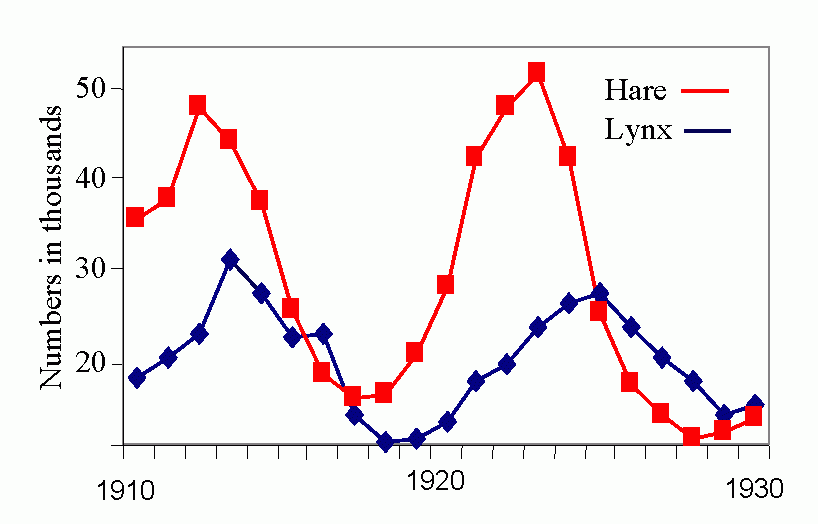
In the 1920s, A. J. Lotka (1925) and V. Volterra (1926) devised mathematical models representing host/prey interaction. This was the first attempt to mathematically represent a population model as achieving a cyclic balance in mean mean (characteristic) population density, i.e., to attain a dynamic equilibrium. The Lotka-Volterra curve assumes that prey destruction is a function not only of natural enemy numbers, but also of prey density, i.e., related to the chance of encounter. Populations of prey and predator were predicted to flucuate in a regular manner (Volterra termed this "the law of periodic cycle"). Lotka-Volterra model is an oversimplification of reality, as these curves are derived from infinitesimal calculus when in nature association is seldom continuous over time (life cycles being finite).
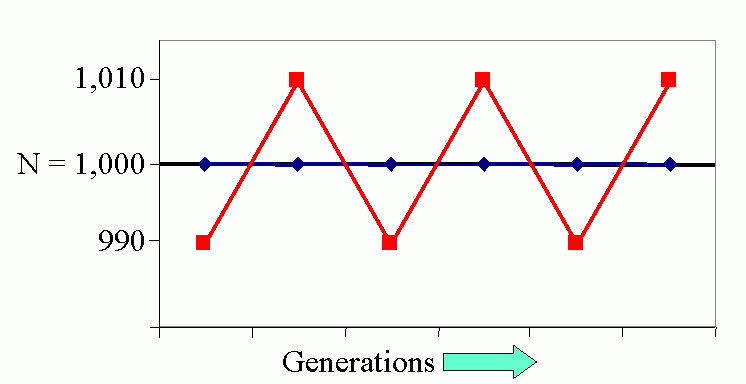
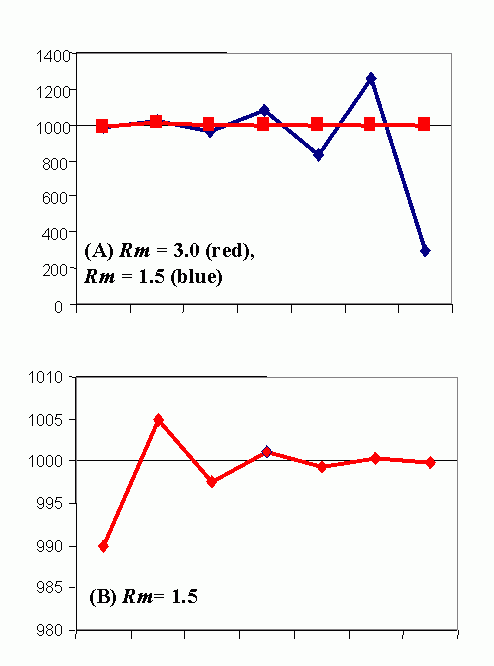
Figure 4C (bottom). Steady-state population model. (N1 = N0 + Rm(1 -sN0 /K)N0 ), when K = 1000, Rm = 1.5 and initial displacement from equilibrium x = -10.
A. J. Nicholson (Australian entomologist) was a leading proponent of concept of density-dependent mortality factors. He maintained that density-dependent mortality played the key role in regulating prey populations. This is the essence of the so-called "Balance of Nature" theory. This theory implied a static balance about a mean (characteristic) equilibrium density with reciprocal (feedback) oscillations in density about these means.
Nicholson and V. A. Bailey (1935) proposed a population model that incorporated a "lag effect". This is particularly appropriate to parasitoids were population effects of attack (oviposition) may not be evident until the parasitoid has completed its immature development and emerges as a adult (killing the host).
Leading proponents of this view of population dynamics included the early California biological control workers. The theory and practice of biological control can be said to revolve about this assumption.
However, a contrary view of the nature of population regulating mortality factors was argued by others, especially W. R. Thompson (Dominion Parasite Laboratory). The Canadian workers held that assumptions of Nicholson and like thinkers were unrealistic, and did not occur in nature, i.e., that the regulating role of a so- called density-dependent mortality factors was largely myth. These workers argued that it was unnecessary to postulate such a mechanism of population regulation. They observed that the environment never remains continually favorable or unfavorable for any species. If it did so that population would inevitably become either infinite or decline to extinction. They maintained it was more accurate to say that populations were (in reality) always in a state of "dynamic equilibrium" with their environment.
H. G. Andrewartha and L. C. Birch were leading proponents of the concept that populations could be, and often are, regulated by abiotic factors.
These arguments became heated in the mid-1950s and early 1960s. Much of the confusion and controversy regarding mechanisms of population regulation stemmed from an inadequate data base, but an even more confining limitation was the essential impracticality of making the extremely complex calculations required to manipulate such data. Accordingly rapid advances in theoretical ecology, especially in the area of population ecology, only occurred with the introduction of high speed computers and the refinement of statistical theory.
Much of early population theory was developed deductively from controlled laboratory experiments or fragmented field observations. This resulted in a tendency to oversimplification and the development of models often not reflecting biological reality.
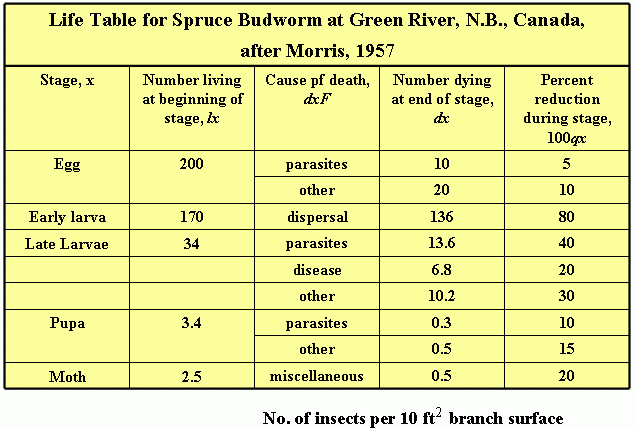
One of the most useful starting points for a population ecologist is the development of a life table. A life table is a schedule of mortality for each cohort (age group) of individuals in the population. The methods were developed originally for actuarial or demographic studies. Multifactor studies which incorporated the life table technique were once largely the province of forest entomologists, but are now widely used in agriculture.
The final test of any population model is its usefulness to predict (generation to generation) changes in abundance or to explain why changes occur at particular population densities.
Consequences of recent advances in understanding of population dynamics has lead to almost universal (among ecologists) acceptance of the proposition that population growth is geared to population density.
Differences in the relative importance of density-dependent and density-independent mortality factors varies in different environments, e.g., the role of biotic components tends to be greater in more stable (benign) environments.
Competitive processes/cooperative processes: we often think of interactions between individuals even within species as only negative, but interactions can be positive (even between species), e.g., defense against predators, genetic diversity (concept of minimum density), mate finding (sustainable population), early mortality may favor subsequent survival.
Interactions between species can be very complex even when only 2 species are considered (through impact on environment of other species). Each species can affect environment of other positively (+), negatively (-), or have no effect (0). Major categories include: mutualism (++), commensualism (+0), predator/prey (+-), competition (- -), and amensalism (rare) (-0).
Insects and plants of two types: 1) good colonizers, e.g., weed species, with high reproductive potential (capacity), adaptable, invaders, readily dispersed, "r-strategists"; 2) good competitors, high survival, tend to stable population (K = equilibrium), exploit stable environments, win out in competition, "K-strategists" (R. H. MacArthur and E. O. Wilson 1967).
Most crop pests are r-strategists, e.g., aphids and phytophagous insects in general. Natural enemies, i.e., parasites and predators, are mostly K strategists. This is said to be one reason for the high failure rate associated with introductions of exotic natural enemies.
Most crop plants are early succession plants, i.e., they are weedy species and accordingly they also are r-strategists. The r-selected species are particularly suited to exploiting the ecological patchiness and instability of the agroecosystem.
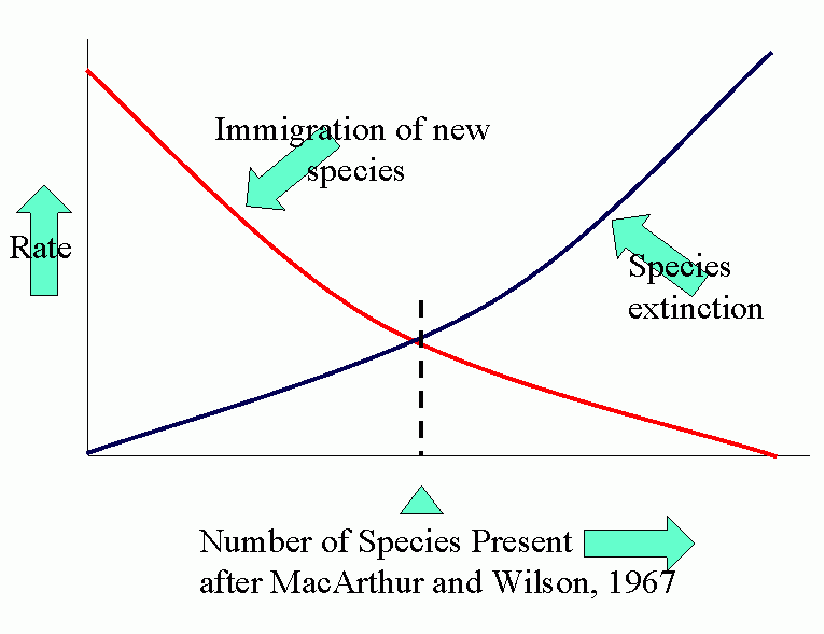
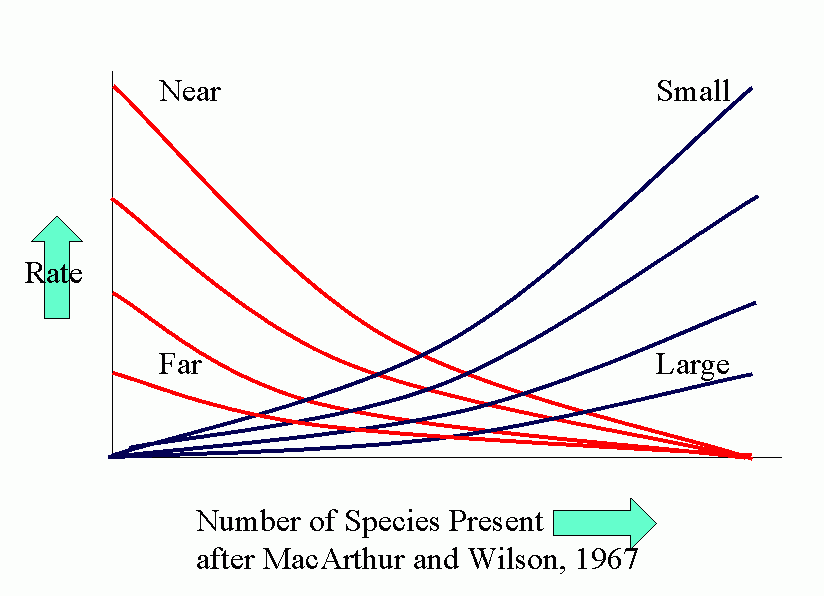
Equilibrium models for near and distant islands. Equilibrium (in number of species present) occurs where curves of rates of immigration and rates of extinction intersect. I is the initial rate of immigration and P is the total number in the species pool on the mainland.
The parallel between agroecosystems and island defaunation is obvious. Many factors affect the various population processes: number of potential invaders, distance of source of invaders, conditions for invasion and settling, attractiveness (favorability) of crop.
Effects of various regulating factors on the population dynamics of the host tend to differ: predators, harmonic (cyclic), parasitoids, intrusive, pathogens, disruptive, food, catastrophic (W. J. Turnock and J. A. Muldrew 1971).
Numerical response is the key to the success of entomophagous insects; occurs in the following ways:
- Concentration, not different from sigmoid curve of functional response.
- Immediate numerical response, increased survival
- Delayed numerical response, increased reproduction.
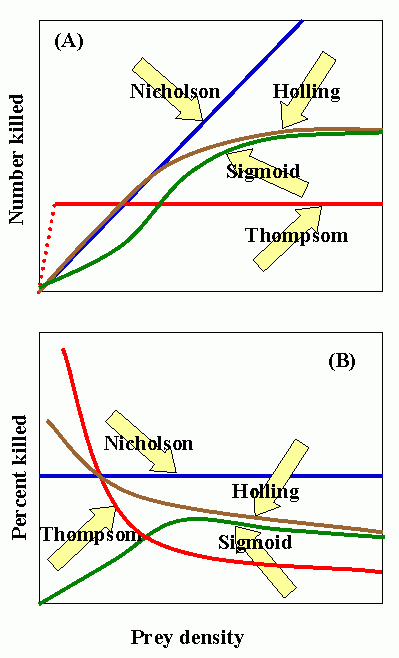
Nicholson curve: number of attacks determined by searching capacity (i.e., density-dependent). C. S. Holling (1965) disk curve: characteristic of invertebrate predators. Sigmoid curve: characteristic of vertebrate predators. Thompson curve: number of attacks limited by capacity for consumption or production of eggs, but not by searching capacity or host density.
Experimental data suggests that Holling's disc curve is characteristic of the predatory behavior of most entomophagous insects, i.e., the number of prey attacked increases but at a proportionately slower rate as prey density increases.
Interactions between species, especially between predators and prey are of great theoretical and practical interest to ecologists.
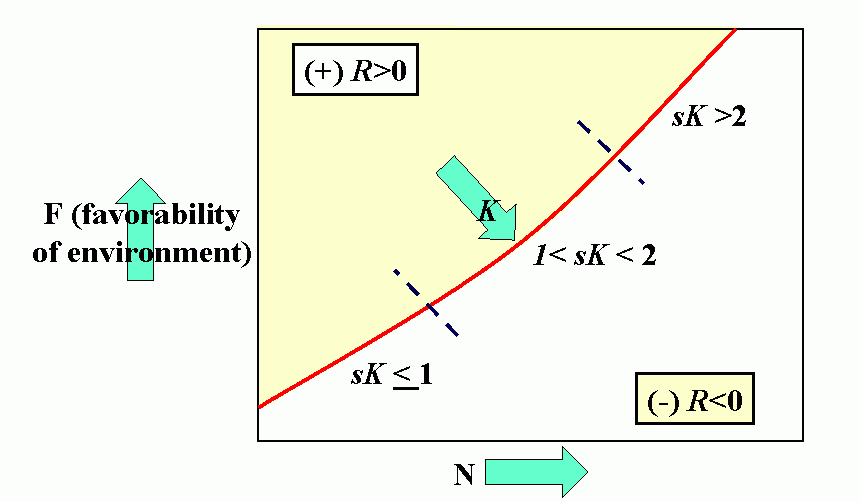
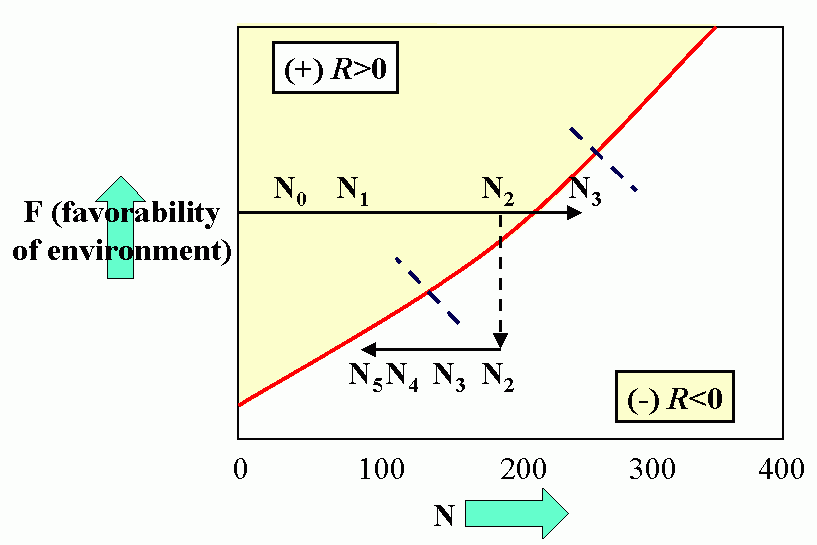
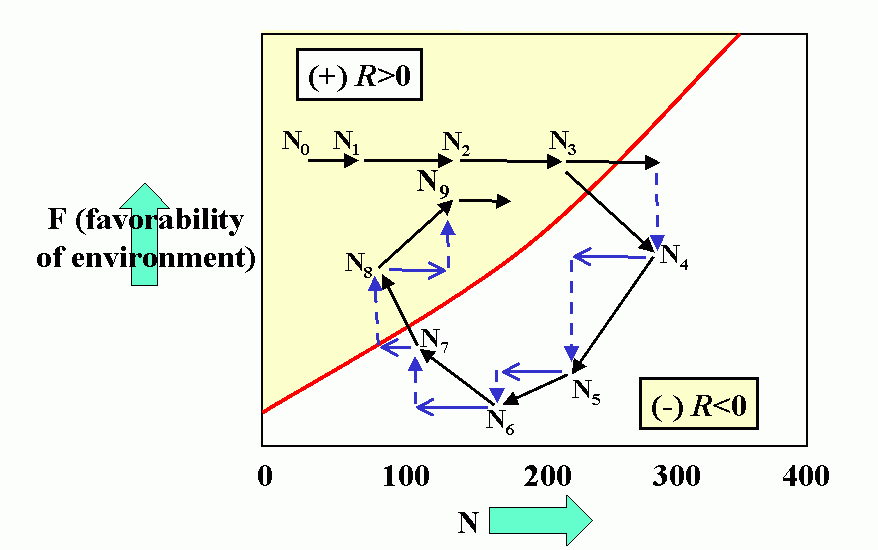
Environmental feedbacks: Populations degrade their environment, utilizing its resources. If the environment is highly favorable, resources are not limiting, i.e., the resources are replaced or recover faster than they are utilized. This favors rapid (exponential) growth of the population. As the rate of utilization of resources approaches the rate of replacement, the rate of population increase slows. Finally, population overshots carrying capacity of environment (resources depleted faster than can be renewed). This results in severe competition and the population collapses. When the population drops below the replacement value the environment recovers.
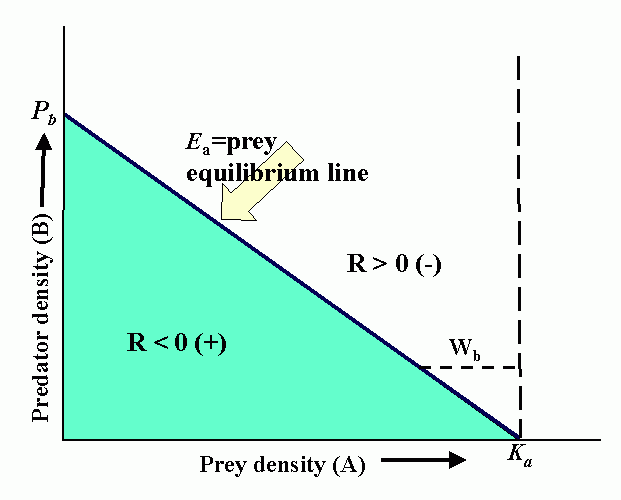
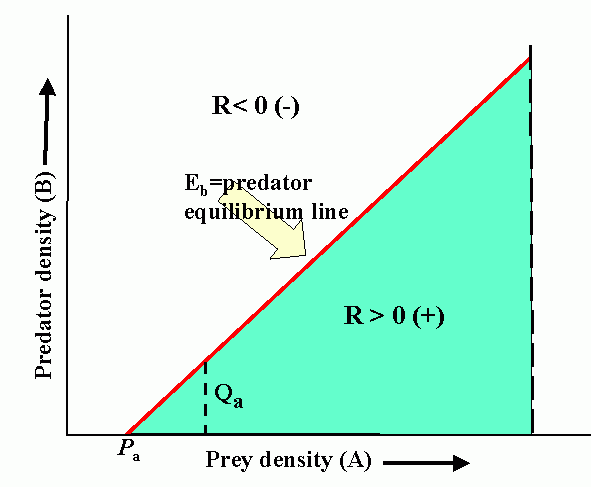
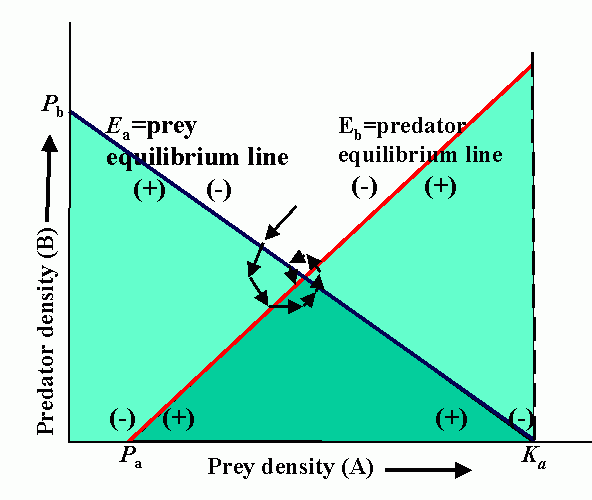
Interactions (reproduction planes) between predator and prey. There must be some prey to sustain the predator. Pb is the predator density which drives prey to extinction. Ka is the carrying capacity in the absence of the predator. Wb is the marginal cost of a given level of predation. Pa is the minimum prey density required to sustain the predator population (and avoid extinction). Qa is the marginal benefit of prey. The superimposed reproduction planes show equilibrium lines for predator, Eb, and prey, Ea, and a particular dynamic trajectory.
We can draw an infinite variety of these curves, relationships not necessarily straight line, stability will depend on characteristic of curves (assuming these represent real life situation).
Community stability: A central tenet of classical ecology is that complex communities tend to be more stable (largely based on observation) theory recently challenged, argument that simple systems may be less subject to external disturbances. What has emerged is that:
- Competitive interactions between species lead to instability unless dominated by negative feedbacks within self-loops, i.e., one species setting in motion cyclic oscillations in numbers of another.
- The number of competing species increase the competitive interactions must be proportionately weaker or instability will result.
- Interactions between tropic levels (predator/prey) tend to stabilize populations (community).
- Community stability is frequently interrupted by severe environmental disruptions, leading to a series of successional communities gradually evolving to climax associations. Frequent or continual disruptions may lead to persistent nonclimax community. Herbivores play an important role in plant succession by tending to harvest unthrifty members of a plant community, e.g., overmature trees. They also recycle nutrients and increase productivity and vigor of community, - mutualistic?
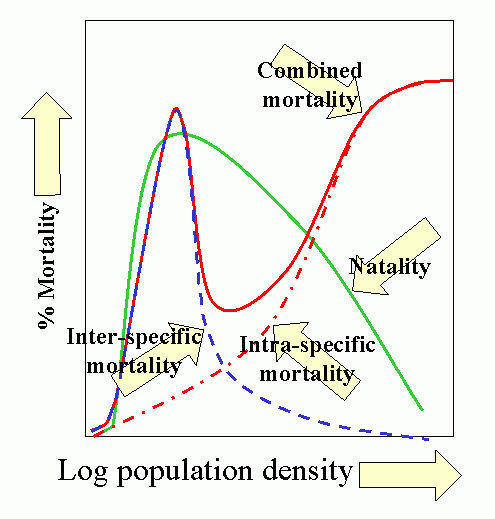
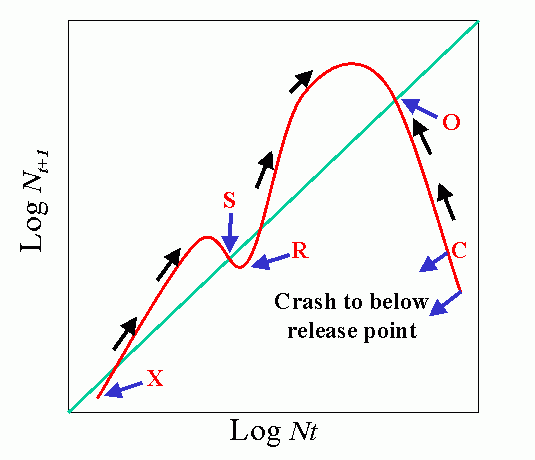
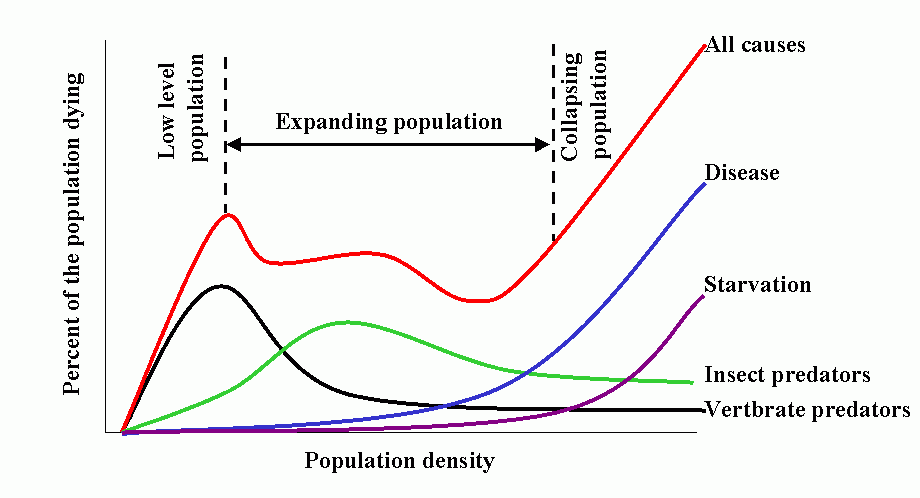
Population dynamics/epidemiology theory is a vast and formidable subject. However, the synoptic model developed by T. R. E. Southwood (1975 and subsequent papers) is most instructive, and summarizes much of the theoretical concepts and empirical bases for contemporary model building.
The model has 3 salient features:
- Natality (birthrate) is low at low population densities because of problems associated with low densities, e.g., finding mates, increases as population increases, peaks and finally declines as intraspecific competition increases, e.g., competition for food.
- Predation increases with increasing host (herbivore) density, then declines as host populations overwhelm (and escape) their regulating influence. This occurs because the characteristic pattern is for overall predator response to be sigmoid, based on a) functional response of the individual predator and b) numerical response of the population.
- Intraspecific competition increases with increased population (prey) density. This produces additional mortality as natality shows a down-turn. Other density-dependent mortality and stress also comes into play producing a marked increase in combined mortality.
Common feature of epidemics (epizootics) is that outward migration (emigration) occurs advancing in waves. Knowledge of spatial distributions and population dynamics can be used to manage populations over large areas.
Simulation games have been used to study and test ecological theory. One such model is the so-called "Game of Life". This is a game invented by a mathematician to illustrate (mimic) environmental feedback loops, a number of individuals (checkers) are positioned at random on board. Rules are that any individual adjacent to one or more neighbors dies of isolation and any adjacent to four or more individuals dies of overcrowding (two negative feedbacks) and that whenever an empty square exists adjacent to exactly three individuals, a new individual is born (a parody of real-life).
The population dynamics of pests occurring over large areas can be investigated by gridding the area and monitoring population trends, studies of dispersal (migration) reproduction, competition, weather, environmental conditions, etc.
Tactics and Strategies:
Pest management is as applied science with no unique principles. Focus of all pest management programs is to "erode the homeostatic capability" ("homeostasis") of pest populations i.e., to reduce the equilibrium position of populations (K) spatially and temporally so that the frequency and duration of fluctuation above economic thresholds are reduced or eliminated.
The tactics (ecological manipulations) and strategies (pest management decision-making processes) distinguish pest management (IPM) from unilateral approaches.
Pest management is the selection, integration, and implementation of pest control strategies on the basis of predicted economic, ecological, and sociological consequences (Rabb 1972).
References
- Liss, W. J., L. J. Gut, P. H. Westigard, and C. E. Warren. 1986. Perspectives on arthropod community structure, organization, and development in agricultural crops. Annual Review of Entomology 31: 455-478.
- Schowalter, T. D., W. W. Hargrove, and D. A. Crossley, Jr. 1986. Herbivory in forested ecosystems. Annual Review of Entomology 31: 177-196.
- Finklestein, L. and E. R. Carson. 1985. Mathematical Modelling of Dynamic Biological Systems. John Wiley & Sons. 355pp.
- Taylor, L. R. 1984. Assessing and interpreting the spatial distributions of insect populations. Annual Review of Entomology 29: 321-57.
- Huffaker, C. B. and R. L. Rabb, editors. 1984. Ecological Entomology. John Wiley & Sons. 844 pp.
- Price, P. W., C. M. Slobdchikoff, and W. S. Gaud, editors. 1984. A New Ecology: Novel Approaches to Interactive Systems. John Wiley & Sons. 515 pp.
- Price, P. W. 1984. Insect Ecology. John Wiley & Sons. 600 pp.
- Odum, H. T. 1983. Systems Ecology: an Introduction. John Wiley & Sons. 644 pp.
- Stinner, R. E. C. S. Barfield, J. L. Stimac, and L. Dohse. 1983. Dispersal and movement of insect pests. Annual Review of Entomology 28: 319-335.
- Berryman, A. A. 1981. Population Systems: A General Introduction. Plenum Press.
- Levins, R. and M. Wilson. 1980. Ecological theory and pest management. Annual Review of Entomology 25: 287-308.
- Furtick, W. R. 1976. Implementing pest management programs: an international perspective. In: Integrated Pest Management, J. L. Apple and R. F. Smith, editors, pp. 17-27. Plenum.
- Apple, J. L. and R. F. Smith. 1976. Progress, problems, and prospects for integrated pest management. In: Integrated Pest Management, J. L. Apple and R. F. Smith, editors, pp. 179-97. Plenum Press.
- Huffaker, C. B., F. J. Simmons, and J. E. Laing. 1976. The theoretical and empiracal basis of biological control. In: Theory and Practice of Biological Control, C. B. Huffaker and P. S. Messenger, editors, Chapter 3, pp. 41-78. Academic Press.
- Price, P. W. and G. P. Waldbauer. 1975. Ecological Aspects of Pest Management. In : Introduction to Insect Pest Management, R. L. Metcalf and W. Luckmann, editors, pp. 37-73. Wiley-Interscience.
- Dempster, J. P. 1975. Animal Population Ecology. Academic Press.
- Pielou, E. C. 1975. Ecological Diversity. John Wiley & Sons, Inc.
- Rabb, R. L., R. E. Stinner, and G. A. Carlson. 1974. Ecological principles as a basis for pest management in the agroecosystem. In: Proceedings of the Summer Institute on Biological Control of Plant Insects and Diseases, F. G. Maxwell and F. A. Harris, editors, pp. 19-45. Univ. Press of Mississippi.
- Sailer, R. I. 1971. Invertebrate predators. In: Toward Integrated Control, pp. 32-44. USDA Forest Research Paper NE-194.
- Turnock, W. J. and J. A. Muldrew. 1971. Parasites. In: Toward Integrated Control, pp. 59-87. USDA Forest Research Paper NE-194.
- Huffaker, C. B., P. S. Messenger, and P. DeBach. 197l. The natural enemy component in natural control and the theory of biological control. In: Biological Control, C. B. Huffaker, editors, pp. 16- 67. Plenum.
- Southwood,T. R. E. and M. J. Way. 1970. Ecological Background to Pest Management. In: Concepts of Pest Management, pp. 6-29. R. L. Rabb and F. E. Guthrie, editors. N. Carolina State Univ.
- Varley, G. C. and G. R. Gradwell. 1970. Recent advances in insect population dynamics. Annual Review of Entomology 15: 1-24.
- Harcourt, D. G. 1969. The development and use of life tables in the study of natural insect populations. Annual Review of Entomology 14: 175-191.
- Huffaker, C. B. and P. S. Messenger. 1964. Population cology- historical development. In: Biological Control of Insect Pests and Weeds. P. DeBach, editors, Chapter 3, pp. 45-73. Reinhold.
- Huffaker, C. B. and P. S. Messenger. 1964. The concept and significance of natural control. In: Biological Control of Insect Pests and Weeds, P. DeBach, editor, Chapter 4, pp. 74-117. Reinhold.